English
add translation
Bootstrap:Data Science
Information and knowledge can be gained through computational processes. An important form of computed knowledge comes from the analysis of data.

Unit 1Students are introduced to Tables in Pyret, and learn about Numbers, Strings, Types, Operations, Contracts, and Function Application.
Unit 2Students are introduced to the Animals dataset, practice making some charts of the data, and consider the kinds of questions that can be asked of a dataset. They also learn to define values, and to define functions using a structured approach to problem solving called the "Design Recipe". They then use these functions to filter the animals dataset.
Unit 3Students continue practicing the Design Recipe, and explore scatter plots as a means of visualizing potential relationships between columns. They also learn how to build new columns, chain methods, and are introduced to Table Plans.
Unit 4Students deepen their understanding of Table Plans, learning how to write a good sample table. They also choose their own datasets, and explore them by writing filters and column builders using the Design Recipe.
Unit 5Students learn how to measure central tendency (using mean, median, and mode), as well as variation (visualizing quartiles with box plots). After applying these concepts to a contrived dataset, they apply them to their own datasets and interpret the results.
Unit 6Students explore new visualizations in Pyret, this time focusing on the frequency of observations in their dataset. They learn how to construct and interpret Frequency Bar Charts and Histograms, experiment with these visualizations in a contrived dataset, apply them to their own research, and interpret the results.
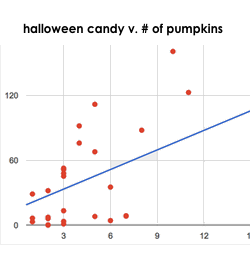
Unit 7Students investigate scatter plots as a method of visualizing the relationship between two axes, and begin searching for correlations in their dataset.
Unit 8Students compute the "line of best fit" using linear regression, and search for correlations in their own datasets.
Unit 9Students consider possible threats to the validity of their analysis